srsRAN gNB with srsUE
Warning
5G extensions in srsUE are no longer in active development, although it does receive small maintenance updates. See here for further details. srsUE is intended to be used for proof-of-concept and initial testing to allow users to test srsRAN Project without the need for expensive hardware. It is not intended for scenarios which require a deployment ready solution.
Overview
srsRAN Project is a 5G CU/DU solution and does not include a UE application. However, srsRAN 4G does include a prototype 5G UE (srsUE) which can be used for testing. This application note shows how to create an end-to-end fully open-source 5G network with srsUE, srsRAN Project gNodeB and Open5GS 5G core network.
Various use-cases are shown here, including both over-the-air and ZeroMQ based setups, and multi-UE emulation.
Hardware and Software Overview
For this application note, the following hardware and software are used:
PC with Ubuntu 22.04.1 LTS
srsRAN 4G (23.11 or later)
Two Ettus Research USRP B210s (connected over USB3)
Ideally the USRPs would be connected to a 10 MHz external reference clock or GPSDO, although this is not a strict requirment. We recommend the Leo Bodnar GPSDO.
srsRAN 4G
If you have not already done so, install the latest version of srsRAN 4G and all of its dependencies. This is outlined in the installation guide.
Please check our srsRAN 4G ZeroMQ Application Note for information on installing ZMQ and using it with srsRAN 4G.
Limitations
The current srsUE implementation has a few feature limitations when running in 5G SA mode. The key feature limitations are as follows:
Limited to 15 kHz Sub-Carrier Spacing (SCS), which means only FDD bands can be used.
Limited to 5, 10, 15 or 20 MHz Bandwidth (BW)
Handover is not supported
Open5GS
For this example, we are using Open5GS as the 5G Core.
Open5GS is a C-language Open Source implementation for 5G Core and EPC. The following links will provide you with the information needed to download and set-up Open5GS so that it is ready to use with srsRAN:
For the purpose of this application note, we will use a dockerized Open5GS version provided in srsRAN Project at srsgnb/docker.
ZeroMQ
For a guide on installing ZMQ and building srsRAN Project correctly, see here.
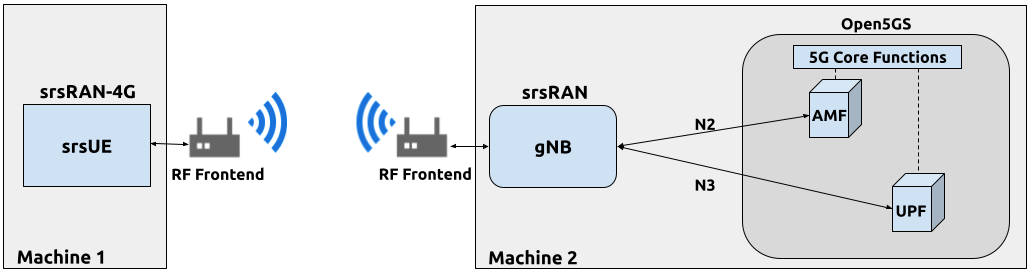
Over-the-air Setup
The following diagram presents the setup architecture:
Configuration
You can find a configuration file for this example in the configs folder of the srsRAN Project source files. You can also find it here:
You can download the srsUE config here:
It is recommended you use these files to avoid errors while changing configs manually. Any configuration files not included here do not require modification from the default settings. Details of the modifications made are outlined in following sections.
gNB
The following changes need to be made to the gNB configuration file.
The gNB has to connect to AMF in the 5G core network, therefore we need to provide two IP addresses:
cu_cp:
  amf:
    addr: 10.53.1.2                 # The address or hostname of the AMF. Check Open5GS config -> amf -> ngap -> addr
    port: 38412
    bind_addr: 10.53.1.1            # A local IP that the gNB binds to for traffic from the AMF.
    supported_tracking_areas:
      - tac: 7
        plmn_list:
          - plmn: "00101"
            tai_slice_support_list:
              - sst: 1
  inactivity_timer: 7200            # Sets the UE/PDU Session/DRB inactivity timer to 7200 seconds. Supported: [1 - 7200].
Next, we have to configure the RF front-end device:
ru_sdr:
  device_driver: uhd                # The RF driver name.
  device_args: type=b200            # Optionally pass arguments to the selected RF driver.
  clock: external                   # Use external reference clock with USRP B210.
  srate: 23.04                      # RF sample rate might need to be adjusted according to selected bandwidth.
  tx_gain: 75                       # Transmit gain of the RF might need to adjusted to the given situation.
  rx_gain: 75                       # Receive gain of the RF might need to adjusted to the given situation.
Finally, we configure the 5G cell parameters:
cell_cfg:
  dl_arfcn: 368500                  # ARFCN of the downlink carrier (center frequency).
  band: 3                           # The NR band.
  channel_bandwidth_MHz: 20         # Bandwith in MHz. Number of PRBs will be automatically derived.
  common_scs: 15                    # Subcarrier spacing in kHz used for data.
  plmn: "00101"                     # PLMN broadcasted by the gNB.
  tac: 7                            # Tracking area code (needs to match the core configuration).
  pdcch:
    common:
      ss0_index: 0                  # Set search space zero index to match srsUE capabilities
      coreset0_index: 12            # Set search CORESET Zero index to match srsUE capabilities
    dedicated:
      ss2_type: common              # Search Space type, has to be set to common
      dci_format_0_1_and_1_1: false # Set correct DCI format (fallback)
  prach:
    prach_config_index: 1           # Sets PRACH config to match what is expected by srsUE
srsUE
The following changes need to be made to the UE configuration file to allow it to connect to the gNB in SA mode.
First, the following parameters need to be changed under the [rf] options so that the B210 is configured optimally:
[rf]
freq_offset = 0
tx_gain = 50
rx_gain = 40
srate = 23.04e6
nof_antennas = 1

device_name = uhd
device_args = clock=external       # Use external reference clock with USRP B210.
time_adv_nsamples = 300
The next set of changes need to be made to the [rat.eutra] options. The LTE carrier is disabled, to force the UE to use a 5G NR carrier:
[rat.eutra]
dl_earfcn = 2850
nof_carriers = 0
Then, the [rat.nr] options need to be configured for 5G SA mode operation:
[rat.nr]
bands = 3
nof_carriers = 1
max_nof_prb = 106
nof_prb = 106
The max_nof_prb and nof_prb parameters have to be adapted for the used bandwidth according to the following table:
BW |
PRBs |
|---|---|
5 |
25 |
10 |
52 |
15 |
79 |
20 |
106 |
Lastly, set the release and ue_category:
[rrc]
release = 15
ue_category = 4
Note that the following (default) USIM Credentials are used:
[usim]
mode = soft
algo = milenage
opc  = 63BFA50EE6523365FF14C1F45F88737D
k    = 00112233445566778899aabbccddeeff
imsi = 001010123456780
imei = 353490069873319
The APN is enabled with the following configuration:
[nas]
apn = srsapn
apn_protocol = ipv4
Running the Network
The following order should be used when running the network:
5GC
gNB
UE
Open5GS Core
srsRAN Project provides a dockerized version of the Open5GS. It is a convenient and quick way to start the core network. You can run it as follows:
cd ./srsRAN_Project/docker
docker compose up --build 5gc
Note that we have already configured Open5GS to operate correctly with srsRAN Project. Moreover, the UE database is populated with the credentials used by our srsUE.
gNB
We run gNB directly from the build folder, i.e., ./srsRAN_Project/build/apps/gnb/, (the config file is also located there) with the following command:
sudo ./gnb -c ./gnb.yaml
The console output should be similar to:
--== srsRAN gNB (commit 374200dee) ==--

Connecting to AMF on 10.53.1.2:38412
[INFO] [UHD] linux; GNU C++ version 9.2.1 20200304; Boost_107100; UHD_3.15.0.0-2build5
[INFO] [LOGGING] Fastpath logging disabled at runtime.
Making USRP object with args 'type=b200'
[INFO] [B200] Detected Device: B210
[INFO] [B200] Operating over USB 3.
[INFO] [B200] Initialize CODEC control...
[INFO] [B200] Initialize Radio control...
[INFO] [B200] Performing register loopback test...
[INFO] [B200] Register loopback test passed
[INFO] [B200] Performing register loopback test...
[INFO] [B200] Register loopback test passed
[INFO] [B200] Setting master clock rate selection to 'automatic'.
[INFO] [B200] Asking for clock rate 16.000000 MHz...
[INFO] [B200] Actually got clock rate 16.000000 MHz.
[INFO] [MULTI_USRP] Setting master clock rate selection to 'manual'.
[INFO] [B200] Asking for clock rate 23.040000 MHz...
[INFO] [B200] Actually got clock rate 23.040000 MHz.
Cell pci=1, bw=20 MHz, dl_arfcn=368500 (n3), dl_freq=1842.5 MHz, dl_ssb_arfcn=368410, ul_freq=1747.5 MHz
The Connecting to AMF on 10.53.1.2:38412 message indicates that gNB initiated a connection to the core.
If the connection attempt is successful, the following (or similar) will be displayed on the Open5GS console:
Open5GS    | 04/17 10:00:43.567: [amf] INFO: gNB-N2 accepted[10.53.1.1]:41578 in ng-path module (../src/amf/ngap-sctp.c:113)
Open5GS    | 04/17 10:00:43.567: [amf] INFO: gNB-N2 accepted[10.53.1.1] in master_sm module (../src/amf/amf-sm.c:706)
Open5GS    | 04/17 10:00:43.567: [amf] INFO: [Added] Number of gNBs is now 1 (../src/amf/context.c:1034)
Open5GS    | 04/17 10:00:43.567: [amf] INFO: gNB-N2[10.53.1.1] max_num_of_ostreams : 30 (../src/amf/amf-sm.c:745)
srsUE
Finally, we start srsUE. This is also done directly from within the build folder (i.e., /srsRAN_4G/build/srsue/), with the config file in the same location:
sudo ./srsue ue_rf.conf
If srsUE connects successfully to the network, the following (or similar) should be displayed on the console:
Reading configuration file ./ue_rf.conf...

Built in Release mode using commit eea87b1d8 on branch master.

Opening 1 channels in RF device=default with args=clock=external
Supported RF device list: UHD zmq file
Trying to open RF device 'UHD'
[INFO] [UHD] linux; GNU C++ version 9.2.1 20200304; Boost_107100; UHD_3.15.0.0-2build5
[INFO] [LOGGING] Fastpath logging disabled at runtime.
[INFO] [MPMD FIND] Found MPM devices, but none are reachable for a UHD session. Specify find_all to find all devices.
Opening USRP channels=1, args: type=b200,master_clock_rate=23.04e6
[INFO] [UHD RF] RF UHD Generic instance constructed
[INFO] [B200] Detected Device: B210
[INFO] [B200] Operating over USB 3.
[INFO] [B200] Initialize CODEC control...
[INFO] [B200] Initialize Radio control...
[INFO] [B200] Performing register loopback test...
[INFO] [B200] Register loopback test passed
[INFO] [B200] Performing register loopback test...
[INFO] [B200] Register loopback test passed
[INFO] [B200] Asking for clock rate 23.040000 MHz...
[INFO] [B200] Actually got clock rate 23.040000 MHz.
RF device 'UHD' successfully opened
Setting manual TX/RX offset to 300 samples
Waiting PHY to initialize ... done!
Attaching UE...
Random Access Transmission: prach_occasion=0, preamble_index=0, ra-rnti=0x39, tti=2094
Random Access Complete.     c-rnti=0x4602, ta=0
RRC Connected
PDU Session Establishment successful. IP: 10.45.1.2
RRC NR reconfiguration successful.
It is clear that the connection has been made successfully once the UE has been assigned an IP, this is seen in PDU Session Establishment successful. IP: 10.45.1.2.
The NR connection is then confirmed with the RRC NR reconfiguration successful. message.
Testing the Network
Here, we demonstrate how to use ping and iPerf3 tools to test the connectivity and throughput in the network.
Routing Configuration
Before being able to ping UE, you need to add a route to the UE on the host machine (i.e. the one running the Open5GS docker container):
sudo ip ro add 10.45.0.0/16 via 10.53.1.2
Check the host routing table:
route -n
It should contain the following entries (note that Iface names might be different):
Kernel IP routing table
Destination     Gateway         Genmask         Flags Metric Ref    Use Iface
0.0.0.0         192.168.0.1     0.0.0.0         UG    100    0        0 eno1
10.45.0.0       10.53.1.2       255.255.0.0     UG    0      0        0 br-dfa5521eb807
10.53.1.0       0.0.0.0         255.255.255.0   U     0      0        0 br-dfa5521eb807
...
Next, add a default route for the UE as follows:
sudo ip route add default via 10.45.1.1 dev tun_srsue
Ping
Ping is the simplest tool to test the end-to-end connectivity in the network, i.e., it tests whether the UE and core can communicate.
Uplink
To test the connection in the uplink direction, run the following command from the UE machine:
ping 10.45.1.1
Downlink
To test the connection in the downlink direction, run the following command from the machine running the core network (i.e., Open5GS docker container):
ping 10.45.1.2
The IP for the UE can be taken from the UE console output. This might change each time a UE reconnects to the network, so it is best practice to always double-check the latest IP assigned by reading it from the console before running the downlink traffic.
Ping Output
Example ping output:
# ping 10.45.1.1 -c 4
PING 10.45.1.1 (10.45.1.1) 56(84) bytes of data.
64 bytes from 10.45.1.1: icmp_seq=1 ttl=64 time=39.9 ms
64 bytes from 10.45.1.1: icmp_seq=2 ttl=64 time=38.9 ms
64 bytes from 10.45.1.1: icmp_seq=3 ttl=64 time=37.0 ms
64 bytes from 10.45.1.1: icmp_seq=4 ttl=64 time=36.1 ms

--- 10.45.1.1 ping statistics ---
4 packets transmitted, 4 received, 0% packet loss, time 3004ms
rtt min/avg/max/mdev = 36.085/37.952/39.859/1.493 ms
iPerf3
iPerf3 is a tool that generates (TCP and UDP) traffic and measures parameters (e.g., throughput and packet loss) of the traffic flow.
In this example, we generate traffic in the uplink direction. To this end, we run an iPerf3 client on the UE side and a server on the network side. UDP traffic will be generated at 10Mbps for 60 seconds. It is important to start the server first, and then the client.
Network-side
Start the iPerf3 server the machine running the core network (i.e., Open5GS docker container):
iperf3 -s -i 1
The server listens for traffic coming from the UE. After the client connects, the server prints flow measurements every second.
UE-side
With the network and the iPerf3 server up and running, the client can be run from the UE’s machine with the following command:
# TCP
iperf3 -c 10.53.1.1 -i 1 -t 60
# or UDP
iperf3 -c 10.53.1.1 -i 1 -t 60 -u -b 10M
Traffic will now be sent from the UE to the network. This will be shown in both the server and client consoles. Additionaly, we will observe console traces of the UE and the gNB.
Note: All routes have to be configured as presented in Routing Configuration for USRP-based setup section.
iPerf3 Output
Example server iPerf3 output:
# iperf3 -s -i 1
-----------------------------------------------------------
Server listening on 5201
-----------------------------------------------------------
Accepted connection from 10.45.1.2, port 40544
[  5] local 10.45.1.1 port 5201 connected to 10.45.1.2 port 40546
[ ID] Interval           Transfer     Bitrate
[  5]   0.00-1.00   sec  1.20 MBytes  10.1 Mbits/sec
[  5]   1.00-2.00   sec  1.22 MBytes  10.2 Mbits/sec
[  5]   2.00-3.00   sec  1.16 MBytes  9.71 Mbits/sec
[  5]   3.00-4.00   sec  1.12 MBytes  9.44 Mbits/sec
[  5]   4.00-5.00   sec  1.25 MBytes  10.5 Mbits/sec
[  5]   5.00-6.00   sec  1.25 MBytes  10.5 Mbits/sec
Example client iPerf3 output:
# iperf3 -c 10.53.1.1 -i 1 -t 60 -u -b 10M
Connecting to host 10.45.1.1, port 5201
[  5] local 10.45.1.2 port 40546 connected to 10.45.1.1 port 5201
[ ID] Interval           Transfer     Bitrate         Retr  Cwnd
[  5]   0.00-1.00   sec  1.20 MBytes  10.1 Mbits/sec    0    117 KBytes
[  5]   1.00-2.00   sec  1.25 MBytes  10.5 Mbits/sec    0    130 KBytes
[  5]   2.00-3.00   sec  1.25 MBytes  10.5 Mbits/sec    0    130 KBytes
[  5]   3.00-4.00   sec  1.12 MBytes  9.44 Mbits/sec    0    130 KBytes
[  5]   4.00-5.00   sec  1.25 MBytes  10.5 Mbits/sec    0    130 KBytes
[  5]   5.00-6.00   sec  1.12 MBytes  9.44 Mbits/sec    0    130 KBytes
Console Traces
The following example trace was taken from the srsUE console while running the above iPerf3 test:
---------Signal-----------|-----------------DL-----------------|-----------UL-----------
rat  pci  rsrp   pl   cfo | mcs  snr  iter  brate  bler  ta_us | mcs   buff  brate  bler
 nr    1     0    0 -457m |  27   43   1.3   274k    0%    0.0 |  27   136k    13M    0%
 nr    1     0    0 -122m |  27   43   1.4   285k    0%    0.0 |  27    0.0    13M    0%
 nr    1     0    0 -282m |  27   43   1.3   267k    0%    0.0 |  27    47k    13M    0%
 nr    1     0    0  -14m |  27   43   1.4   274k    0%    0.0 |  27    3.0    13M    0%
 nr    1     0    0 -373m |  27   43   1.4   268k    0%    0.0 |  27    47k    13M    0%
 nr    1     0    0  244m |  27   43   1.3   274k    0%    0.0 |  27    0.0    13M    0%
To read more about the UE console trace metrics, see the UE User Manual.
The following example trace was taken from the gNB console at the same time period as the srsUE trace shown above:
          -------------DL----------------|------------------UL--------------------
pci rnti  cqi  mcs  brate   ok  nok  (%) | pusch  mcs  brate   ok  nok  (%)    bsr
  1 4601   15   27   275k  328    0   0% |  23.2   28    13M  398    0   0%  55.5k
  1 4601   15   27   266k  336    0   0% |  23.1   28    13M  387    0   0%    0.0
  1 4601   15   27   284k  349    0   0% |  23.1   28    13M  410    1   0%    0.0
  1 4601   15   27   258k  315    0   0% |  23.1   28    12M  371    0   0%    0.0
  1 4601   15   27   275k  330    0   0% |  23.2   28    13M  394    0   0%  55.5k
  1 4601   15   27   265k  332    0   0% |  23.2   28    13M  386    1   0%    0.0
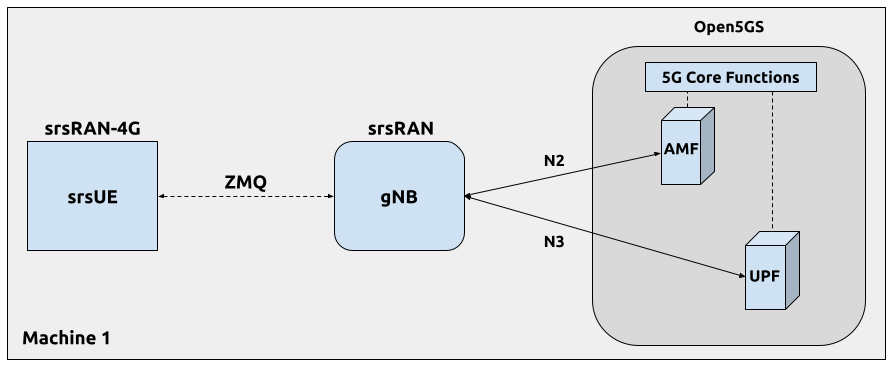
ZeroMQ-based Setup
In this section, we describe the steps required to configure the ZMQ-based RF driver in both gNB and srsUE. The following diagram presents the setup architecture:
Configuration
The following config files were modified to use ZMQ-based RF driver:
Details of the modifications made are outlined in following sections.
gNB
Replacing the UHD driver with the ZMQ-based RF driver requires changing only ru_sdr sections of the gNB file:
ru_sdr:
  device_driver: zmq
  device_args: tx_port=tcp://127.0.0.1:2000,rx_port=tcp://127.0.0.1:2001,base_srate=23.04e6
  srate: 23.04
  tx_gain: 75
  rx_gain: 75
srsUE
When using the ZMQ-based RF driver in the srsUE, it is important to create an appropriate network namespace in the host machine. This is achieved with the following command:
sudo ip netns add ue1
To verify the new “ue1” network namespace exists, run:
sudo ip netns list
Then, the [rf] section in the srsUE config file has to be changed as follows:
[rf]
freq_offset = 0
tx_gain = 50
rx_gain = 40
srate = 23.04e6
nof_antennas = 1

device_name = zmq
device_args = tx_port=tcp://127.0.0.1:2001,rx_port=tcp://127.0.0.1:2000,base_srate=23.04e6
In addition, the srsUE must be configured to use the created network namespace. This is achieved by updating the [gw] section of the config file:
[gw]
netns = ue1
ip_devname = tun_srsue
ip_netmask = 255.255.255.0
Running the Network
Once the config files are updated, the network can be set up on a single host machine, using the same commands as in the case of the over-the-air setup.
Testing the Network
Routing Configuration
Before being able to ping UE, you need to add a route to the UE on the host machine (i.e. the one running the Open5GS docker container):
sudo ip ro add 10.45.0.0/16 via 10.53.1.2
Check the host routing table:
route -n
It should contain the following entries (note that Iface names might be different):
Kernel IP routing table
Destination     Gateway         Genmask         Flags Metric Ref    Use Iface
0.0.0.0         192.168.0.1     0.0.0.0         UG    100    0        0 eno1
10.45.0.0       10.53.1.2       255.255.0.0     UG    0      0        0 br-dfa5521eb807
10.53.1.0       0.0.0.0         255.255.255.0   U     0      0        0 br-dfa5521eb807
...
Next, add a default route for the UE as follows:
sudo ip netns exec ue1 ip route add default via 10.45.1.1 dev tun_srsue
Check the routing table of ue1:
sudo ip netns exec ue1 route -n
The output should be as follows:
Kernel IP routing table
Destination     Gateway         Genmask         Flags Metric Ref    Use Iface
0.0.0.0         10.45.1.1       0.0.0.0         UG    0      0        0 tun_srsue
10.45.1.0       0.0.0.0         255.255.255.0   U     0      0        0 tun_srsue
Ping
Uplink
To test the connection in the uplink direction, use the following:
sudo ip netns exec ue1 ping 10.45.1.1
Downlink
To run ping in the downlink direction, use:
ping 10.45.1.2
The IP for the UE can be taken from the UE console output. This might change each time a UE reconnects to the network, so it is best practice to always double-check the latest IP assigned by reading it from the console before running the downlink traffic.
Ping Output
Example ping output:
# sudo ip netns exec ue1 ping 10.45.1.1 -c4
PING 10.45.1.1 (10.45.1.1) 56(84) bytes of data.
64 bytes from 10.45.1.1: icmp_seq=1 ttl=64 time=26.6 ms
64 bytes from 10.45.1.1: icmp_seq=2 ttl=64 time=56.9 ms
64 bytes from 10.45.1.1: icmp_seq=3 ttl=64 time=45.2 ms
64 bytes from 10.45.1.1: icmp_seq=4 ttl=64 time=34.9 ms

--- 10.45.1.1 ping statistics ---
4 packets transmitted, 4 received, 0% packet loss, time 3002ms
rtt min/avg/max/mdev = 26.568/40.907/56.878/11.347 ms
iPerf3
In this example, we generate traffic in the uplink direction. To this end, we run an iPerf3 client on the UE side and a server on the network side. UDP traffic will be generated at 10Mbps for 60 seconds. It is important to start the server first, and then the client.
Network-side
Start the iPerf3 server the machine running the core network (i.e., Open5GS docker container):
iperf3 -s -i 1
The server listens for traffic coming from the UE. After the client connects, the server prints flow measurements every second.
UE-side
With the network and the iPerf3 server up and running, the client can be run from the UE’s machine with the following command:
# TCP
sudo ip netns exec ue1 iperf3 -c 10.53.1.1 -i 1 -t 60
# or UDP
sudo ip netns exec ue1 iperf3 -c 10.53.1.1 -i 1 -t 60 -u -b 10M
Traffic will now be sent from the UE to the network. This will be shown in both the server and client consoles. Additionaly, we will observe console traces of the UE and the gNB.
Note: All routes have to be configured as presented in Routing Configuration for ZMQ-based setup section.
Iperf3 Output
Example server iPerf3 output:
# iperf3 -s -i 1
-----------------------------------------------------------
Server listening on 5201
-----------------------------------------------------------
Accepted connection from 10.45.1.2, port 39176
[  5] local 10.45.1.1 port 5201 connected to 10.45.1.2 port 39184
[ ID] Interval           Transfer     Bitrate
[  5]   0.00-1.00   sec  1.18 MBytes  9.91 Mbits/sec
[  5]   1.00-2.00   sec  1.25 MBytes  10.5 Mbits/sec
[  5]   2.00-3.00   sec  1.12 MBytes  9.44 Mbits/sec
[  5]   3.00-4.00   sec  1.17 MBytes  9.85 Mbits/sec
[  5]   4.00-5.00   sec  1.20 MBytes  10.1 Mbits/sec
[  5]   5.00-6.00   sec  1.25 MBytes  10.5 Mbits/sec
Example client iPerf3 output:
#sudo ip netns exec ue1 iperf3 -c 10.53.1.1 -i 1 -t 60 -u -b 10M
Connecting to host 10.45.1.1, port 5201
[  5] local 10.45.1.2 port 39184 connected to 10.45.1.1 port 5201
[ ID] Interval           Transfer     Bitrate         Retr  Cwnd
[  5]   0.00-1.00   sec  1.31 MBytes  11.0 Mbits/sec    0    119 KBytes
[  5]   1.00-2.00   sec  1.12 MBytes  9.44 Mbits/sec    0    132 KBytes
[  5]   2.00-3.00   sec  1.25 MBytes  10.5 Mbits/sec    0    132 KBytes
[  5]   3.00-4.00   sec  1.12 MBytes  9.44 Mbits/sec    0    132 KBytes
[  5]   4.00-5.00   sec  1.25 MBytes  10.5 Mbits/sec    0    132 KBytes
[  5]   5.00-6.00   sec  1.12 MBytes  9.44 Mbits/sec    0    132 KBytes
Console Traces
The following example trace was taken from the srsUE console while running the above iPerf3 test:
---------Signal-----------|-----------------DL-----------------|-----------UL-----------
rat  pci  rsrp   pl   cfo | mcs  snr  iter  brate  bler  ta_us | mcs   buff  brate  bler
 nr    1     9    0 -1.8u |  27   69   1.3   282k    0%    0.0 |  27   136k    13M    0%
 nr    1     8    0  505n |  27   73   1.3   299k    0%    0.0 |  27    0.0    14M    0%
 nr    1     9    0  499n |  27  n/a   1.2   276k    0%    0.0 |  27   110k    13M    0%
 nr    1     9    0  1.8u |  27   66   1.3   295k    0%    0.0 |  27    3.0    14M    0%
 nr    1     9    0  759n |  27   69   1.3   277k    0%    0.0 |  27    68k    13M    0%
 nr    1     9    0  188n |  27   71   1.3   290k    0%    0.0 |  27    0.0    13M    0%
To read more about the UE console trace metrics, see the UE User Manual.
The following example trace was taken from the gNB console at the same time period as the srsUE trace shown above:
          -------------DL----------------|------------------UL--------------------
pci rnti  cqi  mcs  brate   ok  nok  (%) | pusch  mcs  brate   ok  nok  (%)    bsr
  1 4601   15   27   281k  335    0   0% |  65.5   28    13M  396    0   0%  39.8k
  1 4601   15   27   288k  353    0   0% |  65.5   28    14M  412    0   0%  39.8k
  1 4601   15   27   293k  346    0   0% |  65.5   28    13M  410    0   0%  39.8k
  1 4601   15   27   273k  332    0   0% |  65.5   28    13M  384    0   0%    0.0
  1 4601   15   27   286k  345    0   0% |  65.5   28    14M  414    0   0%    0.0
  1 4601   15   27   288k  349    0   0% |  65.5   28    14M  410    0   0%    0.0
Multi-UE Emulation
Note
The Multi-UE scenario outlined here is not inteded to be an optimized, performant, or scalable solution. It is a simple example to demonstrate how to connect multiple UEs to a single gNB using ZMQ and srsUE. Extending your own set-up beyond what is described here may not perform as expected. Users that require a more performant solution should consider using different solutions, such as AmariUE.
To connect multiple UEs to a single gNB using ZMQ-based RF devices, we need a broker that:
receives DL signal from the gNB and sends its copy to each connected UE,
receives UL signal from each connected UE, aggregates them, and sends the aggregated signal to the gNB.
In this tutorial, we use GNU-Radio Companion to implement such a broker, as it allows easy integration with our ZMQ-based RF devices. Specifically, GNU-Radio Companion is a free and open-source software development toolkit that provides signal processing blocks, which can be simply connected to form a signal flow graph. By default, it also provides ZMQ-compatible blocks that allow connecting to external processes (acting as signal sources or sinks) over TCP sockets. We exploit the ZMQ blocks to connect with gNB and srsUE processes and transfer signal samples between them.
The following figure shows the signal flow graph of our broker:
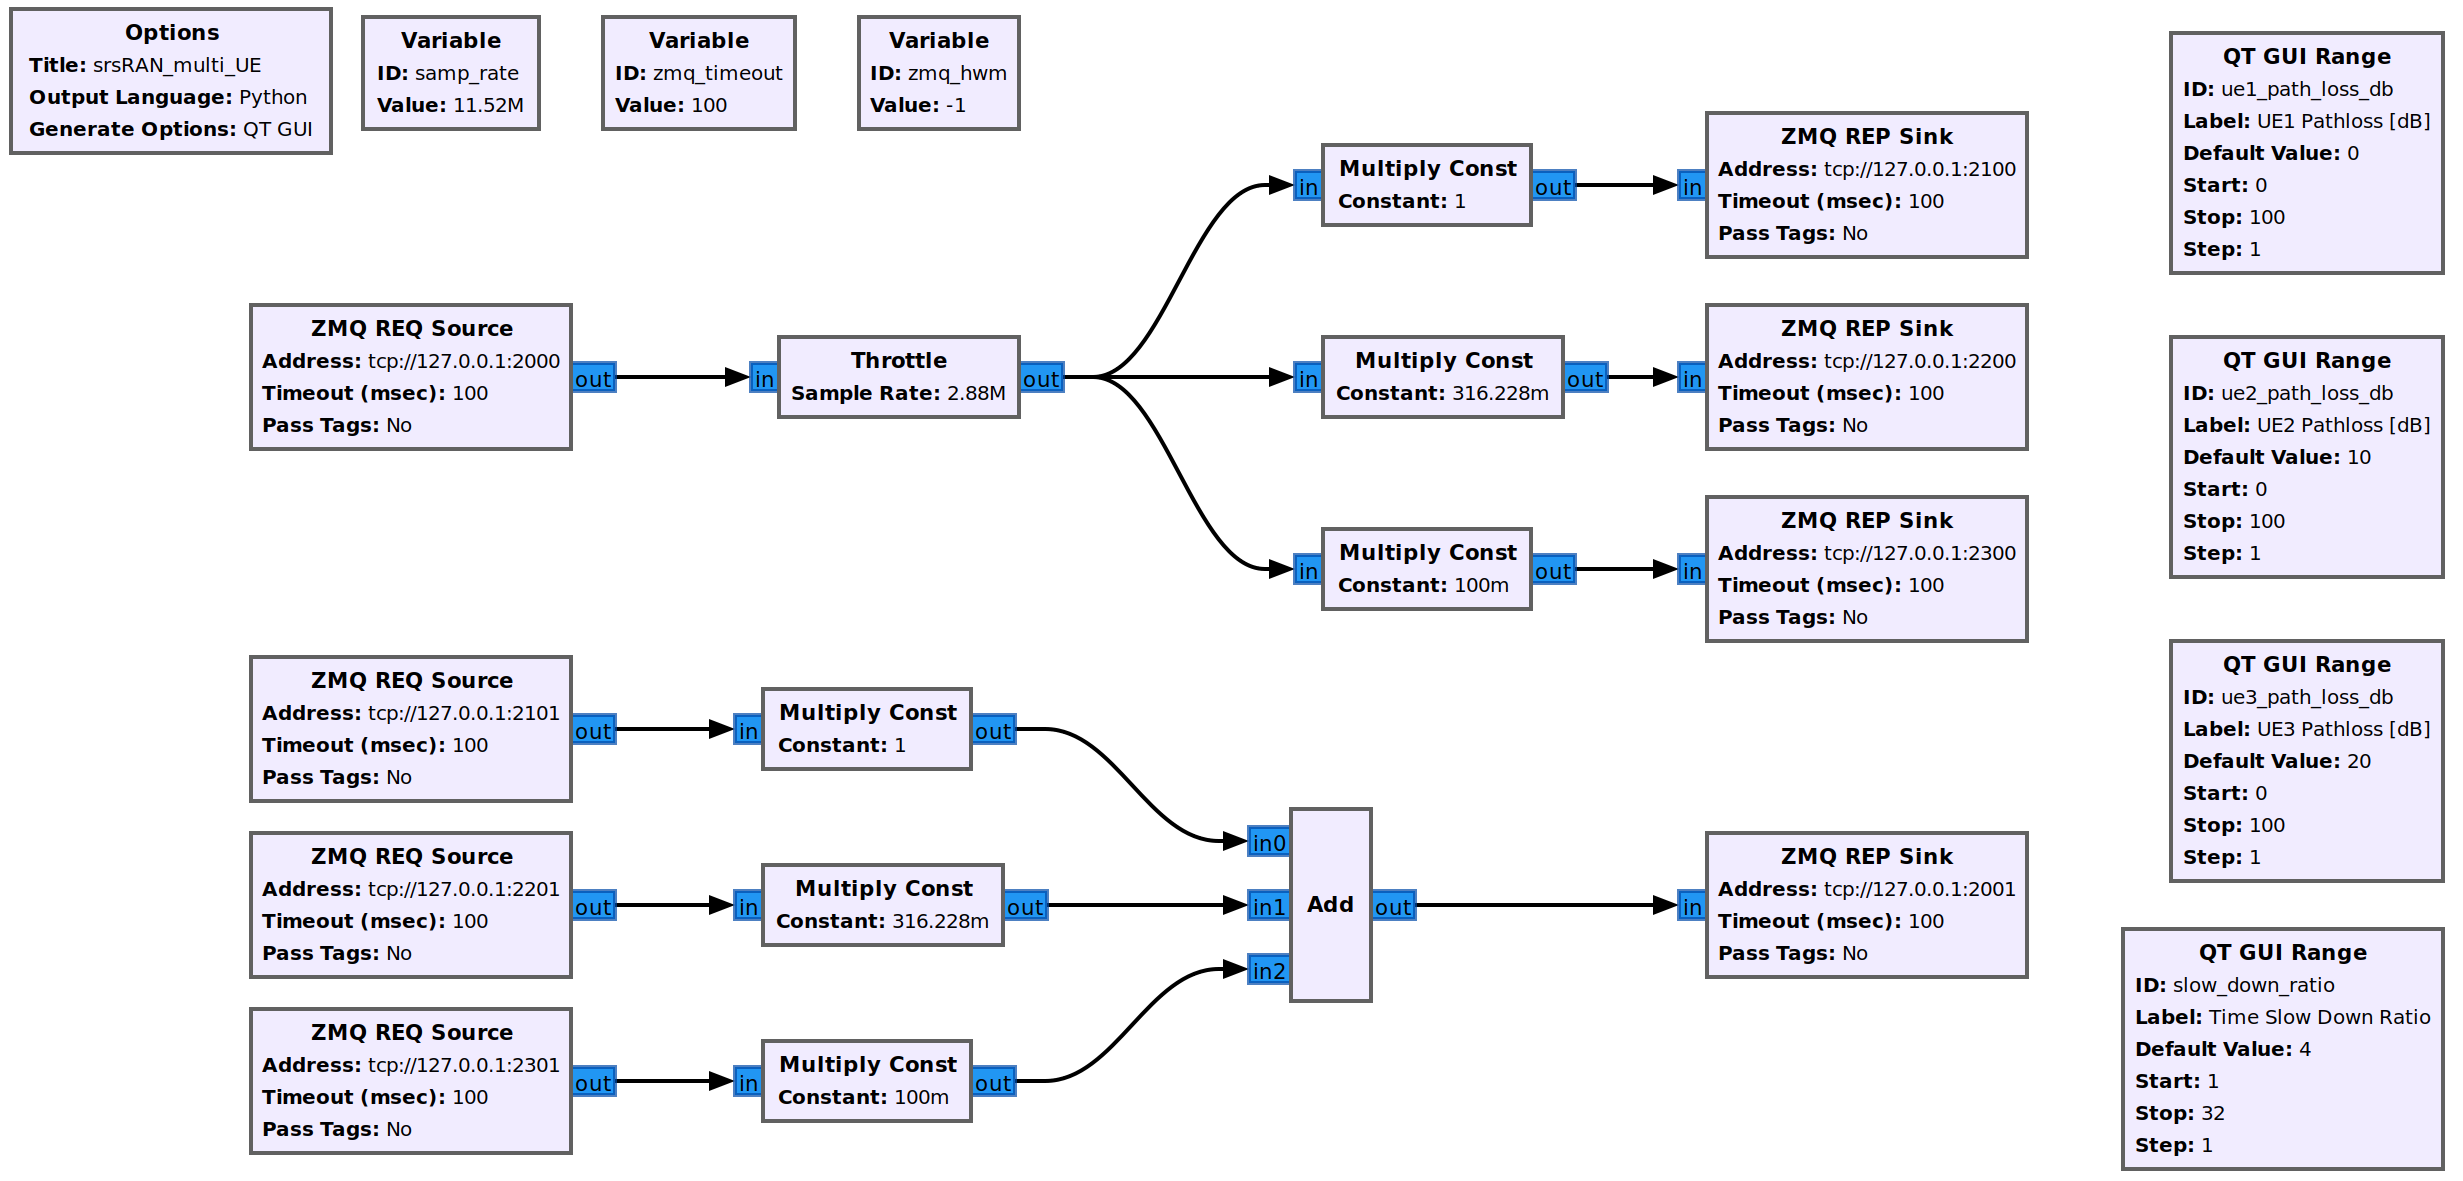
The upper graph is responsible for handling Downlink signal samples, while the lower graph for Uplink signal samples.
Note that here we only provide a simple broker that allows changing path loss separately for each connected UE. But thanks to the rich signal processing block library available in the GNU-Radio Companion, the provided flow graph can be easily extended with any signal processing, manipulation, and/or visualization.
As already mentioned, the GNU-Radio Companion connects over ZMQ sockets with the gNB and srsUE processes (i.e., their ZMQ-based RF devices). The following table lists port numbers are used in the example flow graph:
Port Direction |
gNB |
srsUE1 |
srsUE2 |
srsUE3 |
|---|---|---|---|---|
TX |
2000 |
2101 |
2201 |
2301 |
Rx |
2001 |
2100 |
2200 |
2300 |
Configuration
GNU-Radio Companion
Please install GNU-Radio Companion following the instructions available here. On Ubuntu it can be installed with the following command:
sudo apt-get install gnuradio
GNU-Radio flow graph can be downloaded here:
Note that the flow graph allows connecting three UEs, but it can be easily adapted to support any (but reasonable) UE number.
Open5GS Core
By default, the subscriber database of the dockerized Open5GS Core is populated with only one UE. A file with a list of all UEs used in this example can be downloaded here:
The file needs to be saved at: srsRAN_Project/docker/open5gs/
Then, edit the srsRAN_Project/docker/open5gs/open5gs.env file as follow:
 MONGODB_IP=127.0.0.1
 OPEN5GS_IP=10.53.1.2
 UE_IP_BASE=10.45.0
 DEBUG=false
-SUBSCRIBER_DB=001010123456780,00112233445566778899aabbccddeeff,opc,63bfa50ee6523365ff14c1f45f88737d,8000,9,10.45.1.2
+SUBSCRIBER_DB="subscriber_db.csv"
Alternatively, you can download already edited open5gs.env file here.
gNB
The following gNB config files was modified to operate with a channel bandwidth of 10 MHz and use the ZMQ-based RF driver.
In addition, the total number of available PRACH preambles was set to 63 to mitigate contention among UEs:
  prach:
    prach_config_index: 1           # Sets PRACH config to match what is expected by srsUE
+   total_nof_ra_preambles: 64      # Sets number of available PRACH preambles
+   nof_ssb_per_ro: 1               # Sets the number of SSBs per RACH occasion.
+   nof_cb_preambles_per_ssb: 64    # Sets the number of contention based preambles per SSB.
srsUE
The following srsUE config files were modified to operate with a channel bandwidth of 10 MHz and use the ZMQ-based RF driver. In addition, the config files were modified to allow the execution of multiple srsUE processes on the same host PC. Specifically, each config file has different:
ports for the ZMQ connections, that match the those listed in Ports Used in the GNU-Radio flow graph.
pcap and log filenames,
USIM data (IMSI, etc),
network namespace name.
You can download the srsUE configs here:
Running the Network
The following order must be used when running the network with multiple UEs:
Open5GS
gNB
All UEs
GNU-Radio flow graph.
Open5GS Core
Run Open5GS as follows:
cd ./srsRAN_Project/docker
docker compose up --build 5gc
gNB
Run gNB directly from the build folder (the config file is also located there) with the following command:
cd ./srsRAN_Project/build/apps/gnb
sudo ./gnb -c gnb_zmq.yaml
srsUE
First, a correct network namespace must be created for each UE:
sudo ip netns add ue1
sudo ip netns add ue2
sudo ip netns add ue3
Next, start three srsUE instances, each in a separate terminal window. This is also done directly from within the build folder, with the config files in the same location:
cd ./srsRAN_4G/build/srsue/src
sudo ./srsue ./ue1_zmq.conf
sudo ./srsue ./ue2_zmq.conf
sudo ./srsue ./ue3_zmq.conf
Note, UEs will not connect to the gNB until the GNU-Radio flow graph has been started, as the UL and DL channels are not directly connected between the UE and gNB.
GNU-Radio Companion
Run the GRC Flowgraph associated with the broker.
sudo gnuradio-companion ./multi_ue_scenario.grc
When gnuradio-companion is started, click on the play button (i.e., Execute the flow graph). Now, the signal samples are transferred between gNB and UEs.
After a few seconds, all UE should attach and get an IP address.
If a srsUE connects successfully to the network, the following (or similar) should be displayed on the console:
...
Random Access Transmission: prach_occasion=0, preamble_index=45, ra-rnti=0x39, tti=174
Random Access Complete.     c-rnti=0x4602, ta=0
RRC Connected
PDU Session Establishment successful. IP: 10.45.1.2
RRC NR reconfiguration successful.
It is clear that the connection has been made successfully once the UE has been assigned an IP, this is seen in PDU Session Establishment successful. IP: 10.45.1.2.
The NR connection is then confirmed with the RRC NR reconfiguration successful. message.
Now, you can start traffic (e.g., ping/iperf) to/from each UE using the commands described in the previous section.
Notes:
The gNB and all UEs have to be started before executing the GNU-Radio flow graph.
You will also need to restart the GNU-Radio flow graph each time the network is restarted (i.e., click
Kill the flow graph, and thenExecute the flow graph)
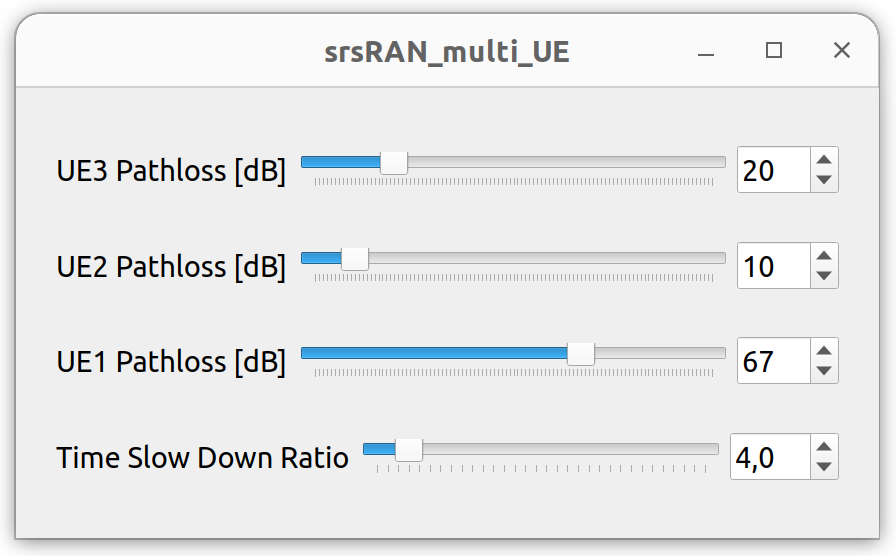
Path-loss Control
The path loss can be controlled for each UE separately via sliders in the flow graph control panel (note, that the control panel pops up after starting the flow graph). The following figure shows the path loss control panel:
You can check the impact of the path loss on the RSRP in each UE. To this end, please activate trace logging in the srsUE console by typing t.
The following example trace shows the changing RSRP that was measured by the UE when setting diverse values of the path loss in the flow graph control panel:
t
Enter t to stop trace.
---------Signal-----------|-----------------DL-----------------|-----------UL-----------
rat  pci  rsrp   pl   cfo | mcs  snr  iter  brate  bler  ta_us | mcs   buff  brate  bler
 nr    1    43    0 -4.5u |   0   65   0.0    0.0    0%    0.0 |   0    0.0    0.0    0%
 nr    1    42    0 -1.4u |   0   65   0.0    0.0    0%    0.0 |   0    0.0    0.0    0%
 nr    1    36    0  -2.3 |   0  n/a   0.0    0.0    0%    0.0 |   0    0.0    0.0    0%
 nr    1     8    0  -12u |   0  n/a   0.0    0.0    0%    0.0 |   0    0.0    0.0    0%
 nr    1     8    0  -16u |   0   84   0.0    0.0    0%    0.0 |   0    0.0    0.0    0%
 nr    1    25    0  -20u |   0   82   0.0    0.0    0%    0.0 |   0    0.0    0.0    0%
 nr    1    42    0  -11u |   0   65   0.0    0.0    0%    0.0 |   0    0.0    0.0    0%
In addition, the control panel allows setting the Time Slow Down Ratio parameter, which controls how fast the samples are transferred between gNB and UEs (i.e., the higher the parameter value, the slower the samples are transferred).
Specifically, GNU-Radio allows to throttle how fast samples are passed between entities (using the Throttle object). By default, the Sample Rate of the Throttle object is set to samp_rate/slow_down_ratio, where samp_rate = 11.52 MHz and slow_down_ratio=4. Therefore, if a connected ZMQ-based RF device generates (and consumes) samples with a sampling rate of 11.52 MHz, it takes 4 seconds to pass them through the GNU-Radio flow graph.
Note that when samples are delivered at slower speeds, gNB and UE have more time to process them (hence lower average CPU load). Therefore, controlling the Time Slow Down Ratio parameter might be helpful when running the emulation on a slower host machine and/or with a high number of UEs.
You can check the impact of the Time Slow Down Ratio parameter on CPU load and network traffic volume on the loopback interface using htop and nload lo, respectively. Also, a ping round-trip time (RTT) between the core network and UEs is impacted when changing this parameter.
Testing the Network
Once the setup is ready, you can start data traffic by following Testing the Network section for the ZMQ-based setup. Note that here we have three UEs (hence, three network namespaces, namely ue1,ue2,ue3), and the default route has to be configured for each of them.
Troubleshooting
Performance Issues
If you experience some performance-related issues (e.g., RF underflows/lates), please run the srsran_performance script on all PCs used in your setup. The script configures the host machine (CPU, etc.) to run with the best possible performance.
Reference clock
If you encounter issues with the srsUE not finding the cell and/or not being able to stay connected it might be due to inaccurate clocks at the RF frontends. Try to use an external 10 MHz reference or use a GPSDO oscillator.
5G QoS Identifier
By default, Open5GS uses 5QI = 9. If the qos section is not provided in the gNB config file, the default one with 5QI = 9 will be generated and the UE should connect to the network. If one needs to change the 5QI, please harmonize these settings between gNB and Open5GS config files, as otherwise, a UE will not be able to connect.
UE does not get IP address
If the UE successfully performs RACH procedure, gets into RRC Connected state, but finally disconnects with RRC Release, this might indicate that the UE database in the core network is not filled properly. Specifically, in such case, the srsUE console output will look similar to this:
Attaching UE...
Random Access Transmission: prach_occasion=0, preamble_index=8, ra-rnti=0x39, tti=174
Random Access Complete.     c-rnti=0x4601, ta=0
RRC Connected
Received RRC Release
You can also check core network logs, for more information on the cause of this event. For example, Open5gs might show the following information in its log output:
open5gs_5gc  | 02/02 09:06:13.742: [amf] INFO: InitialUEMessage (../src/amf/ngap-handler.c:372)
open5gs_5gc  | 02/02 09:06:13.742: [amf] INFO: [Added] Number of gNB-UEs is now 2 (../src/amf/context.c:2327)
open5gs_5gc  | 02/02 09:06:13.742: [amf] INFO:     RAN_UE_NGAP_ID[2] AMF_UE_NGAP_ID[3] TAC[7] CellID[0x19b0] (../src/amf/ngap-handler.c:533)
open5gs_5gc  | 02/02 09:06:13.742: [amf] INFO: [suci-0-001-01-0000-0-0-0123456791] Unknown UE by SUCI (../src/amf/context.c:1634)
open5gs_5gc  | 02/02 09:06:13.742: [amf] INFO: [Added] Number of AMF-UEs is now 2 (../src/amf/context.c:1419)
open5gs_5gc  | 02/02 09:06:13.742: [gmm] INFO: Registration request (../src/amf/gmm-sm.c:985)
open5gs_5gc  | 02/02 09:06:13.742: [gmm] INFO: [suci-0-001-01-0000-0-0-0123456791]    SUCI (../src/amf/gmm-handler.c:149)
open5gs_5gc  | 02/02 09:06:13.743: [dbi] INFO: [imsi-001010123456791] Cannot find IMSI in DB (../lib/dbi/subscription.c:56)
From the above, it is clear that UE data is not present in the subscriber database.
Please check and populate the UE database if needed.
In case you are using Open5gs, you can open http://localhost:9999/ in your browser and log in to its WebUI (user: admin, passwd: 1423). You should see an entry for each IMSI present in a UE database. If the required IMSI is not present, you can add it manually by clicking on the + button in the lower right corner. Note: the WebUI is available when running Open5gs using the docker image we provide. If installed manually, one needs to install the WebUI separately.
In the case of the ZMQ-based setup, please check if you have properly added network namespace for each emulated UE, i.e.:
sudo ip netns add ue1
To verify the new “ue1” network namespace exists, run:
sudo ip netns list
UE IP Forwarding
To ensure that the UE traffic is sent correctly to the internet the correct IP forwarding must be enabled. IP Forwarding should be enabled on the host machine, i.e. the one running the Open5GS docker container. This can be done with the following command:
sudo sysctl -w net.ipv4.ip_forward=1
sudo iptables -t nat -A POSTROUTING -o <IFNAME> -j MASQUERADE
Where <IFNAME> is the name of the interface connected to the internet.
To check that this has been configured correctly run the following command:
sudo ip netns exec ue1 ping -i 1 8.8.8.8
If the UE can ping the Google DNS, then the internet can be successfully accessed.
2nd Open5GS instance (installed manually)
The routing entries on the host PC for IPs: 10.45.0.0 and 10.53.1.0 should use the same interface, e.g.:
route -n

Kernel IP routing table
Destination     Gateway         Genmask         Flags Metric Ref    Use Iface
0.0.0.0         192.168.0.1     0.0.0.0         UG    100    0        0 eno1
10.45.0.0       10.53.1.2       255.255.0.0     UG    0      0        0 br-dfa5521eb807
10.53.1.0       0.0.0.0         255.255.255.0   U     0      0        0 br-dfa5521eb807
...
However, if a second instance of Open5GS (that was installed manually) is running on the host PC, the route to 10.45.0.0 goes to ogstun interface. For this reason, a UE cannot access the Internet, as the host will send packets to the manually installed Open5GS version. To solve this routing issue, you can disable (or even remove) the manually installed Open5GS – please check sections 6 and/or 7 of the Open5GS tutorial. In addition, you might need to disable the ogstun interface with the following command:
sudo ifconfig ogstun 0.0.0.0 down
Run ZMQ-based setup on two host machines
If you want to run gnb and srsUE on two host machines, you need to adapt the IP addresses used for the ZMQ connection as follows:
gNB config:
ru_sdr:
  device_driver: zmq                # The RF driver name.
  device_args: tx_port=tcp://0.0.0.0:2000,rx_port=tcp://<UE_PC_IP_ADDRESS>:2001,base_srate=23.04e6
  ...
srsUE config:
[rf]
...
device_name = zmq
device_args = tx_port=tcp://0.0.0.0:2001,rx_port=tcp://<GNB_PC_IP_ADDRESS>:2000,base_srate=23.04e6
Multiple gNBs connected to a single Docker-based Open5gs
To connect the 2nd gNB to the same Open5gs running in docker, one needs to add a second IP address to the bridge interface connecting to the Open5gs docker container.
Get the name of the Open5gs docker bridge:
ip -o addr show | grep "10.53.1.1"
Add a second IP address to the bridge:
sudo ip addr add 10.53.1.3/24 dev BRIDGE_NAME
Use the IP:10.53.1.3 as
amf.bind_addrin the 2nd gNB config.Remember to use different ZMQ ports for the gNB-UE pairs. Also, the UE has to have different IMSI, that need to be added to the Open5gs database.
USRP X300/X310
The following config files changes are required to run the above setup with USRP X300/X310.
In the gnb config file, the following parameters in ru_sdr section have to changed:
ru_sdr:
  ...
  device_args: type=x300,addr=X.X.X.X,master_clock_rate=184.32e6,send_frame_size=8000,recv_frame_size=8000
  ...
  srate: 30.72
In the srsUE config file, the following parameters have to changed:
[rf]
...
srate = 30.72e6
...
device_args = type=x300,addr=X.X.X.X,master_clock_rate=184.32e6,send_frame_size=8000,recv_frame_size=8000,clock=external
...
[expert]
lte_sample_rates = true
Limitations
srsUE
Multiple TACs
srsUE does not support the use of multiple TACs. Using multple TACs will result in errors parsing NAS messages from the core, resulting in the UE not connecting correctly.