Grafana Metrics GUI
Note
The GrafanaGUI works with both the monolithic gNB and srsDU applications. The configuration changes required are the same for both applications.
srsRAN Project allows the reporting and visualization of the CU/DU metrics to a Grafana WebUI. This is done through the use
of a Docker container that comes as standard with the srsRAN code base, located in the docker/ folder. This container allows users
to bring up the Grafana dashboard in a single command.
Further Reading:
Configuration
To use the Grafana webUI, you will first need to have Docker installed on your system, you will also need to modify the gNB or DU configuration file to allow the reporting of the metrics to the necessary JSON format for use in the webUI.
Docker
Using the Docker Containers included with srsRAN requires docker compose to be installed on your system. You can read about docker compose here. There
are multiple ways to install this, but the most basic way to do so is to install Docker Desktop. For installing Docker Desktop on linux, take a look at
the Docker documentation.
Note
We recommend using a Docker Compose V2 or later.
srsRAN Project
To enable the correct reporting of metrics to the Grafana UI, the gNB or DU configuration files needs to be updated to allow the metrics to be output in the correct JSON format and then sent through a udp-socket to the metrics-server, where it can be parsed and displayed correctly by the GUI.
The addr and port values defined above mirror those set in the docker-compose.yml file found in the /docker folder. Any changes in these values must be kept consistent across both files.
Launching GUI
To launch the docker image for the Grafana UI, run the following command from the main folder containing srsRAN:
sudo docker compose -f docker/docker-compose.yml up grafana
The following output should be observed:
Creating network "docker_ran" with the default driver
Starting metrics_server ...
Starting metrics_server ... done
Creating grafana        ... done
Attaching to grafana
Navigating to http://localhost:3300/ in your preferred web browser will allow you to view the UI.
You can then run srsRAN Project as normal. As the UE(s) connect to the network you will begin to see an output for each. These figures and graphics will update automatically during runtime, showing plots for each UE on the network.
GUI Output
A sample of the UI output can be seen here:
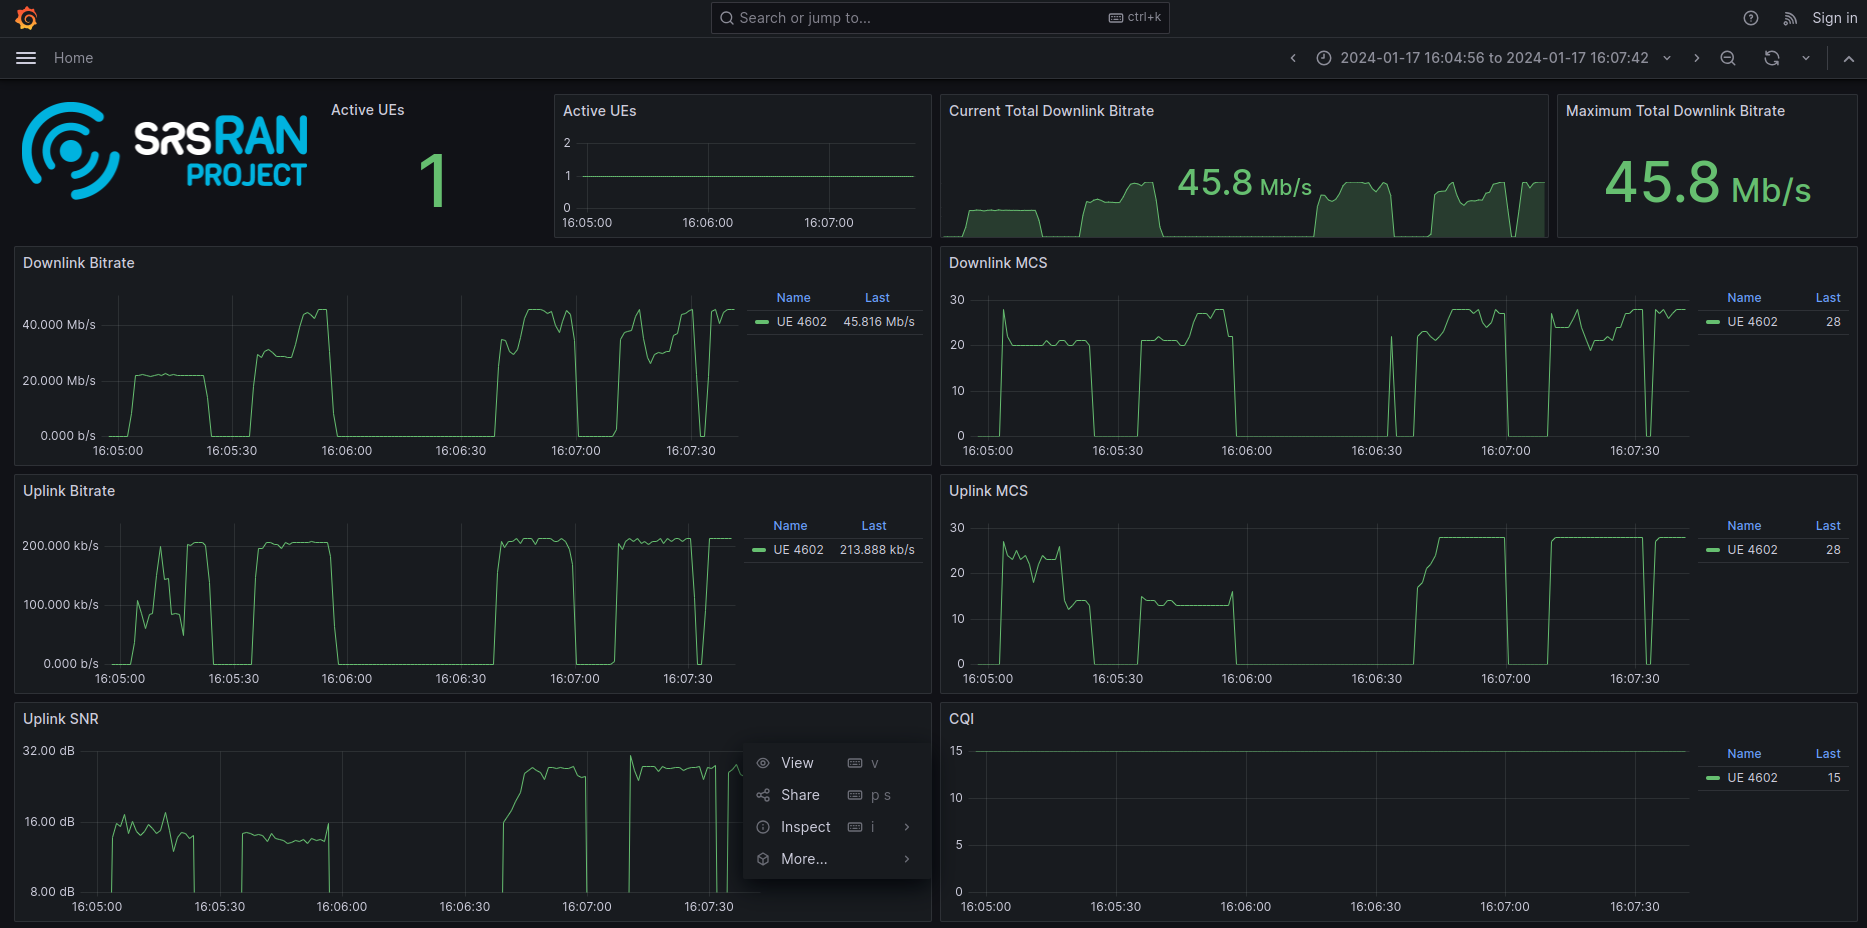
The above figure shows a single COTS UE connected to the network, with different traffic bursts of varying bandwidth being generated using iPerf. The cell bandwidth is 20 MHz.